If you’re a Java developer and have to run your applications in Kubernetes, there is a decent chance that, at some point, you have said to yourself that it would be nice to have remote debug access or at least some kind of profiling information to see how your application performs in real life, not just with some sample data. This is especially relevant when optimizing a process or addressing a possible memory leak, where monitoring tools indicate a gradual increase in memory consumption over time.
There is also a significant chance of encountering an OOM killed status or an exit code 137 in Kubernetes; if so, you know that you need to optimize your memory management.
Memory configuration: JVM vs Kubernetes
In Kubernetes, you can limit CPU and memory resources. It’s not that big of a deal to exceed your CPU limit, you’ll just get throttled, which is not great, especially since Java applications tend to use more CPUs during boot time. If you struggle with this issue and like to live on the edge, you can check out the Google kube-startup-cpu-boot repository. But overshooting memory can kill your app. Indeed, Kubernetes will terminate it with an OOM status.
On the Java side, it’s a bit more complex. It’s common to set the -Xmx value to limit the heap. But it’s a common misconception that you should set the max heap size to the same value as the limit in Kubernetes. This is wrong because Java needs a bit more than that. Indeed, some non-heap memory is still required. By setting -Xmx={kubernetes.limit.memory}, you’re in trouble since your app may grow more than the available memory.
Remote debug to a running JVM
For this to work, enable remote debugging on your JVM. This can be done by adding the following options:
-agentlib:jdwp=transport=dt_socket,server=y,address=5005,suspend=nThis will open port 5005 so you can remotely connect (any IDE should support the option to remote debug). suspend=(y/n) indicates whether the application should wait for a debugger to be connected before starting. This is useful if you want to debug the application from the start.
Of course, once the pod is running, you will need to forward the port to your local machine.
kubectl port-forward -n <namespace> <pod-name> 5005:5005Be aware that if you pause your application for too long, Kubernetes may kill it since the liveness probe will fail (assuming that you implemented some health check in your application).
Inspect memory and CPU usage
It is possible to get information about a running JVM using JMX. For this, we would need to add the following options to the JVM:
-Dcom.sun.management.jmxremote
-Dcom.sun.management.jmxremote.authenticate=false
-Dcom.sun.management.jmxremote.ssl=false
-Dcom.sun.management.jmxremote.local.only=false
-Dcom.sun.management.jmxremote.port=5000
-Dcom.sun.management.jmxremote.rmi.port=5000
-Djava.rmi.server.hostname=127.0.0.1
This will have the effect of opening the JMX port 5000. Again, like for debugging, we need to forward the port to our local machine:
kubectl port-forward -n <namespace> <pod-name> 5000:5000Visual VM
A great open-source tool to help you profile your running application is VisualVM. Most IDEs like IntelliJ or VSCode can have it integrated, but it works great as a standalone application.
If you right-click on “Local”, you can add a jmx connection. Just use localhost:5000. You should see your application, after a few seconds.
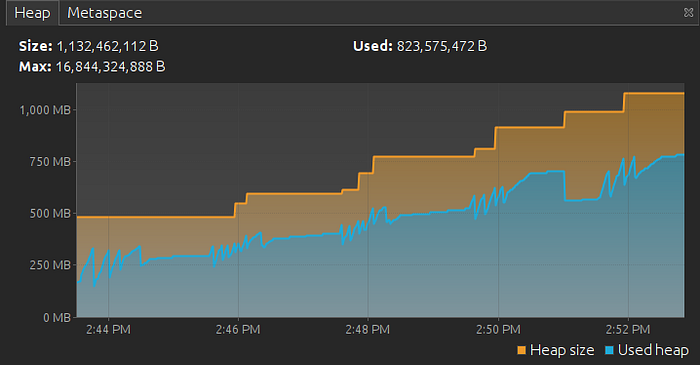
The tree on the left shows you the running applications and snapshots (if you take some). On the main panel, you will be presented with different tabs. “Monitor” will contain a summary of all the important metrics, a memory leak would already be visible here. The second most important tab in our case is “Sampler”, it allows you to take sample of the CPU and memory.
Identify a memory leak
If you can see in the monitor that the memory is growing indefinitely regardless of the garbage collector executions (indicated by GC activity on the left), there is a fair chance that some resources are not freed correctly.

Now, the hunt can begin! Go to the Tracer. There, you will be able to trace the memory and see what kind of object is taking space. It’s not uncommon to see that byte[] takes 90% of the memory. But that doesn’t help much. Sometimes, if you know your own code, you can get a good idea right away about what is causing your issue at this point.
To be sure, the best thing to do is a heap dump. This can be launched from the monitor. It can take a while, but Visual VM will greet you with a file path option (usually under /tmp/). This file will be stored on the pod; you must retrieve it locally. For this, you can use kubectl as shown:
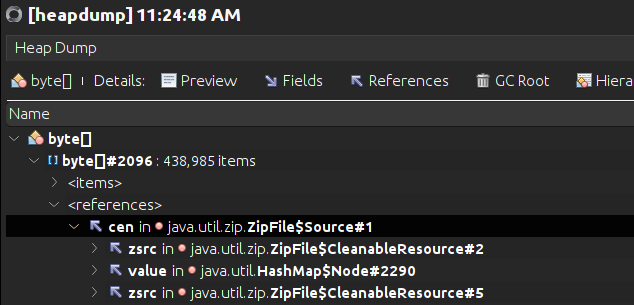
kubectl cp -n <namespace> <pod-name>:<path> <destination-on-local-system>Once you have the file, you can open it with File > Load. In the summary, you will again find the objects that take the most space. If you click on one type, you can see the reference. This way, you can see where this object was created (and maybe forgotten).
CPU profiling
You can check the CPU usage if your app is not performing as expected. To do this, go back to Visual VM in the Sampler tab. From there, you can start sampling the CPU usage. Let it run for a while.
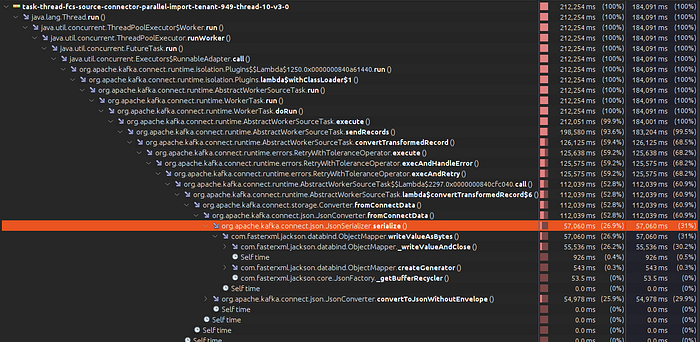
You will have two essential values: total time and total time (CPU). The first is how long the thread/method has been running (including waits). The second is how much CPU was actually used. If you see a method with a lot of time used but only a little CPU time, it means that this method was mostly waiting. It could be for a sleep, a lock, an IO or anything that could block the code but not use the CPU.
In the example below, we can see that the CPU time is identical to the total time. We can conclude that this method is CPU-bound. When we looked for the bottleneck in this case, we saw that the conversion to JSON was a concern.
In this next example, we can see that we use a lot of CPU, but the CPU time goes low at some point while the total time spent in the method is significant. This means that the CPU has nothing to do and is just waiting. In this case, we’re waiting for the database.

Quarkus native
Quick aside about Quarkus: If you’re using Quarkus in native mode, it’s still possible to use JMX. But you will have to configure this during compile time using.
-Dquarkus.native.monitoring=allMore info: https://quarkus.io/guides/building-native-image#using-monitoring-options
Continuous profiling
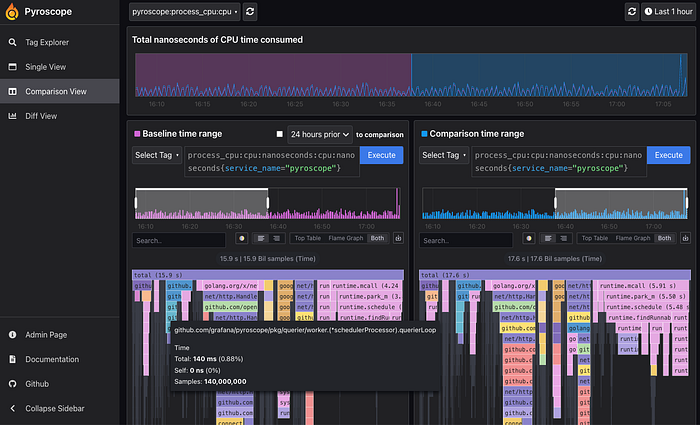
So far, we have talked about manually connecting to a running JVM in Kubernetes. But we would like to have this information directly in our monitoring tool. This is where standards like OpenTracing and tools like Pyroscope come in handy. Such tools will continuously profile your application and give you a nice UI to see what’s happening. Be aware that this comes at a slight performance cost. A full discussion of such tools is beyond the scope of this article, but it is worth mentioning. We may write another article about it.
Conclusion
Profiling and debugging Java applications on Kubernetes is essential for optimizing performance and resolving issues. This guide covered enabling remote debugging, using JMX for monitoring, and leveraging VisualVM for profiling and memory leak detection. We also mentioned continuous profiling with tools like Pyroscope for real-time insights.
By mastering these tools and techniques, you can gain valuable insights into your application’s behaviour, identify bottlenecks, and enhance performance. We hope this guide equips you with the knowledge to troubleshoot your Java applications effectively on Kubernetes. Happy debugging!
Want to talk to the author about it? Reach out to us: https://www.linkedin.com/company/spoud.io
